


AirBnB Data Visualisation
- charles perez
- 16 avr. 2019
- 1 min de lecture
This is a data visualisation exercice to perform with Tableau Software. It is originally a Tableau Challenge with only two questions. It has been extended to cover the key features of tableau software.
You need two files for this exercice :
- The tableau dashboard containing the dataset (NY Airbnb CC.docx)
- The instructions that are in a separated word file (AirBnB_Lab.docx)
Answer the following questions. For each question, create separate sheets in Tableau, make a screenshot of the visual from Tableau that provided you the answer and paste it in this document.
Before opening the Tableau dashboard, please change the extension of the file to NY Airbnb CC.twbx
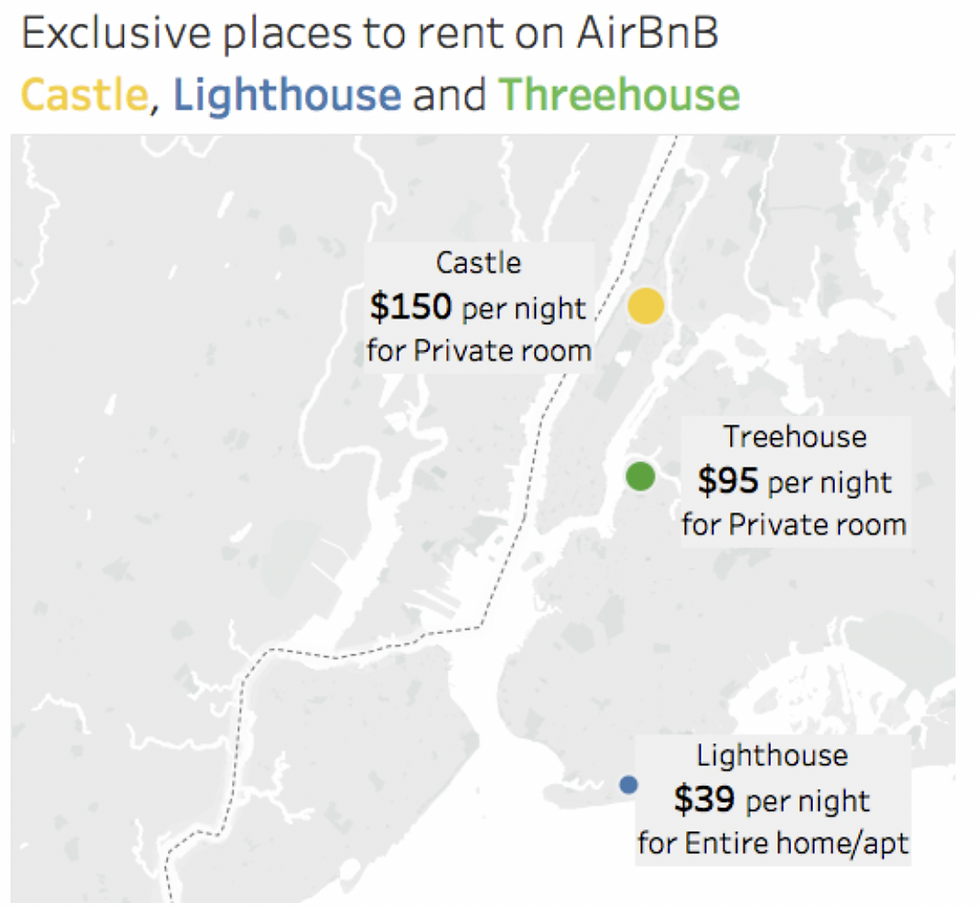
Below is an example of visualisation to accomplish during this exercise.
Merci pour cet article intéressant intitulé « AirBnB Data Visualisation » : la visualisation des données relatives aux offres, aux prix et à la disponibilité sur la plateforme Airbnb permet de mieux comprendre le marché de la location et du tourisme. À propos, jetez un œil au site https://znaki.fm/fr/casinos/nouveaux/ vous y trouverez des avis sur les nouveaux casinos en ligne : leurs conditions, leurs bonus, leurs offres de jeux.